Prism Real-Time Executive BI & Data Viz
Turning sprawling enterprise telemetry into scannable financial boards and interactive query views.
Prism Real-Time Executive BI & Data Viz — Tokens, Typography & Live UI Kit
Click any brand token swatch below to copy its HEX value and live-theme the interactive component kit for this product.
Plus Jakarta Sans + JetBrains Mono (Tabular Columns)
Dense 12-Col Bento • 8px Analytical Card Radius
From Problem Framing to Shipped Craft
Discovery & User Research
Finance and ops leaders exported CSVs because crowded BI dashboards hid key anomalies behind nested menus.
Audited cognitive bottlenecks, conducted contextual user interviews, and mapped friction points to eliminate redundant decision steps.
Challenge
Finance and ops leaders exported CSVs because crowded BI dashboards hid key anomalies behind nested menus.
Shift
Unified inline query pills, keyboard-navigable tables, and high-contrast series tokens into one crisp workspace.
Research & Analyst Pain Points
Observing finance directors and operations analysts showed a telling workaround: teams routinely exported raw CSV spreadsheets rather than trusting crowded BI boards. Rainbow-colored charts, unaligned proportional numerals, and nested filter modals obscured actual variance signals.
Dense Grid Architecture & Tabular Clarity
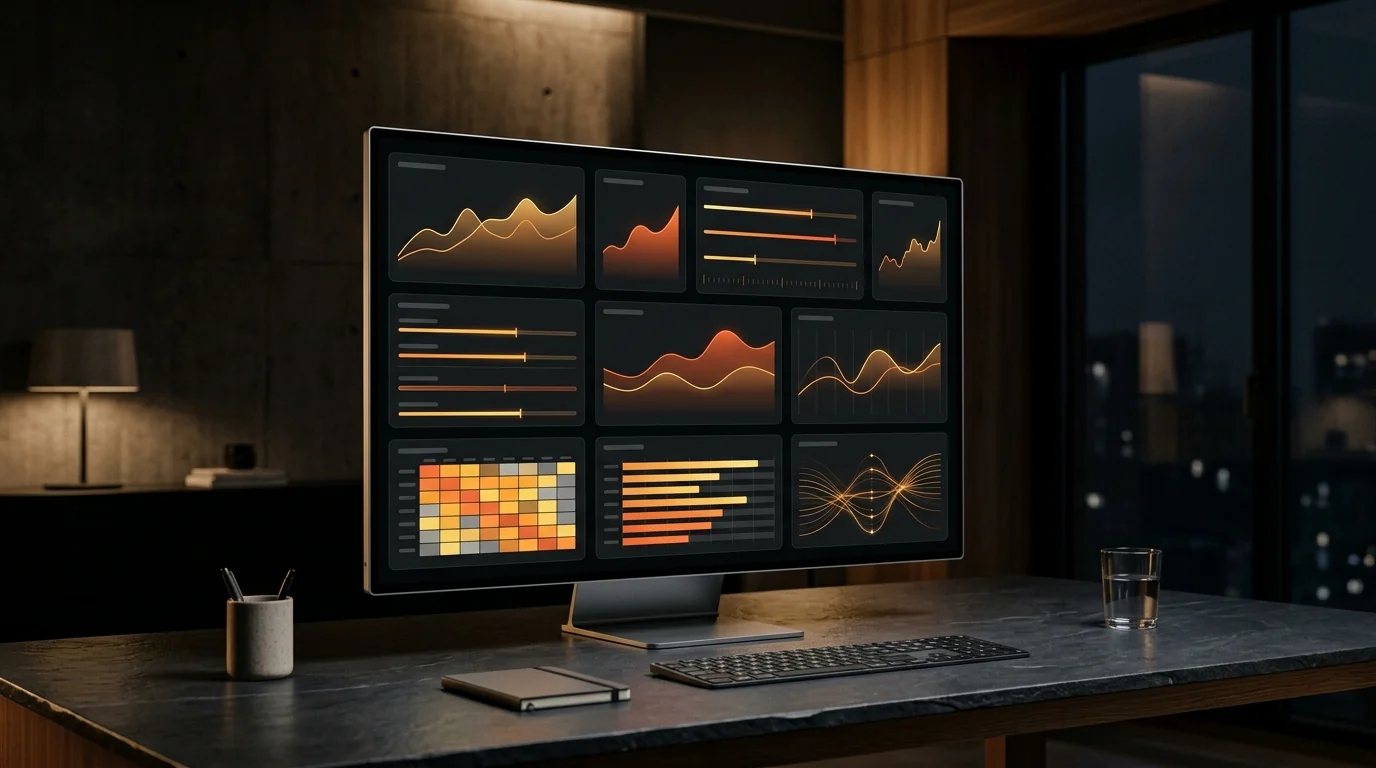
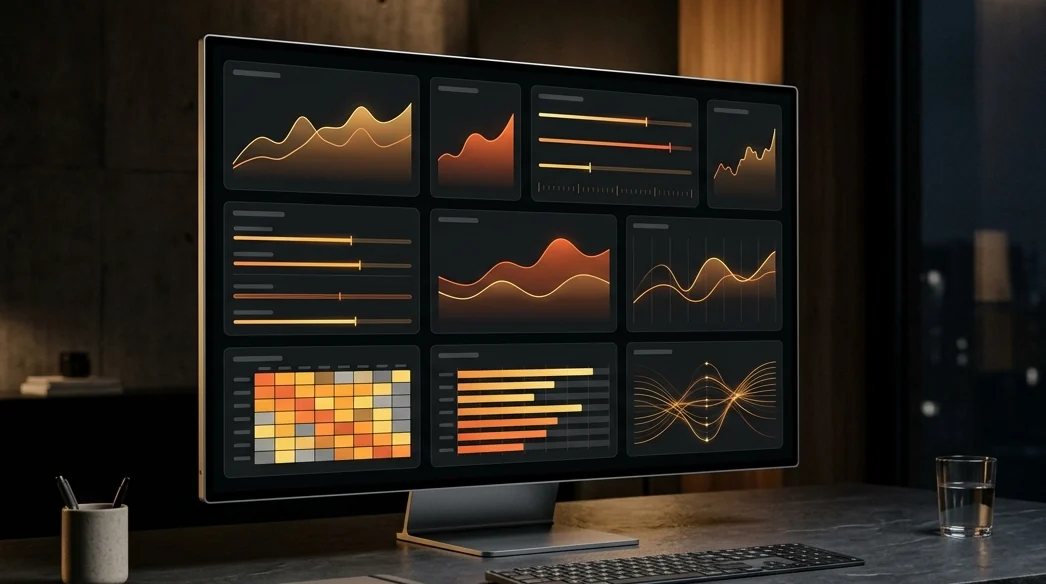
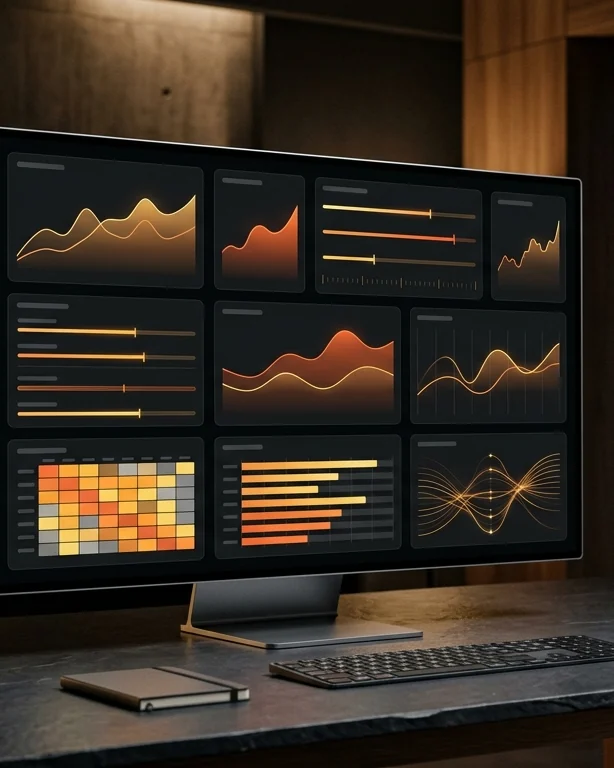
We built a calm 12-column analytical bento anchored by strict tabular-nums alignment, subdued hairline axes, and a restrained cyan-and-amber signal palette. Forty-eight tokenized visualization modules adapt cleanly across executive overview boards and multi-thousand-row financial ledgers.
Inline Query Pills & Contextual Drill-Down
Clicking any chart bar or ledger cell opens a synchronized side-inspector sheet while keeping active inline filter chips and scroll position completely intact.
Outcomes & Learnings
Treating data visualization with editorial restraint rather than flashy 3D gradients enabled leadership teams to diagnose anomalies directly inside Prism without falling back to manual spreadsheets.